
Twitter Sentiment Analysis
Problem
Explain the opportunity for improvement we were called in to assist with.
Solution
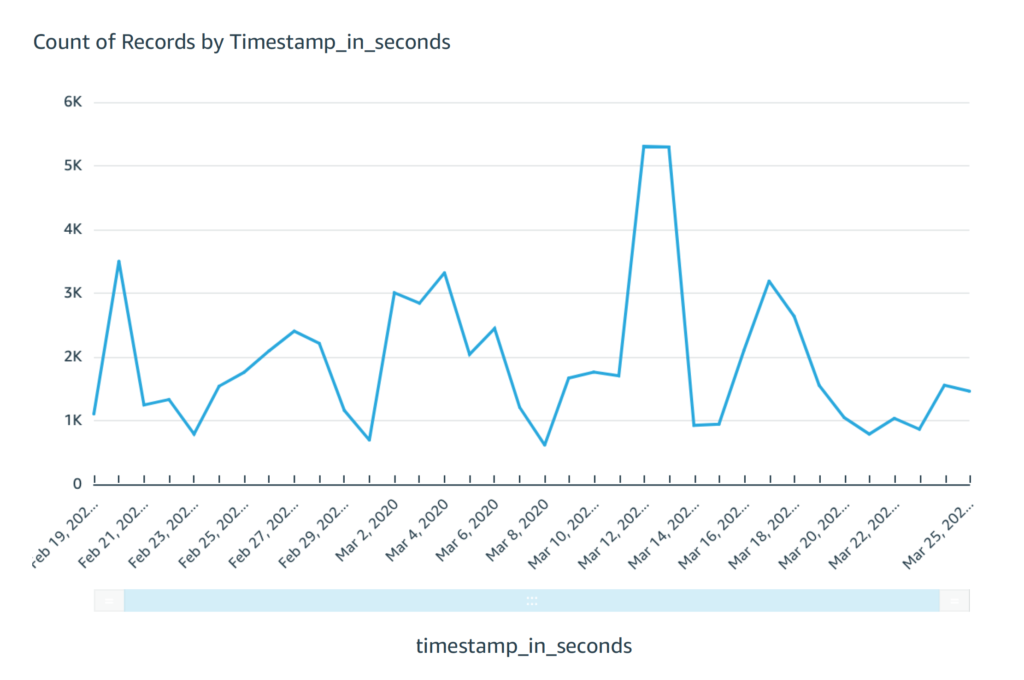
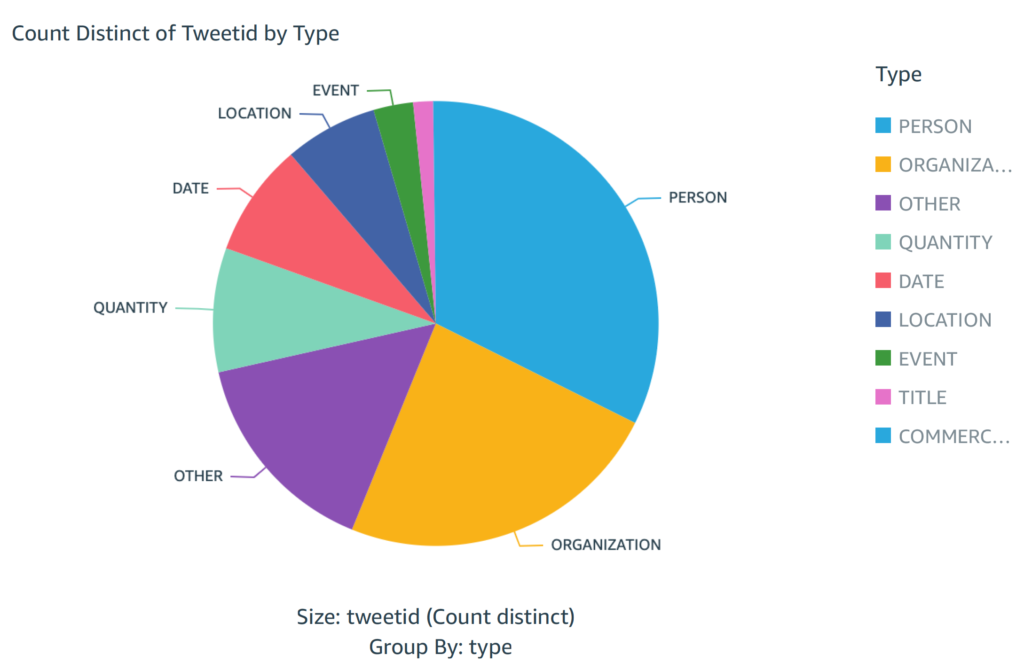
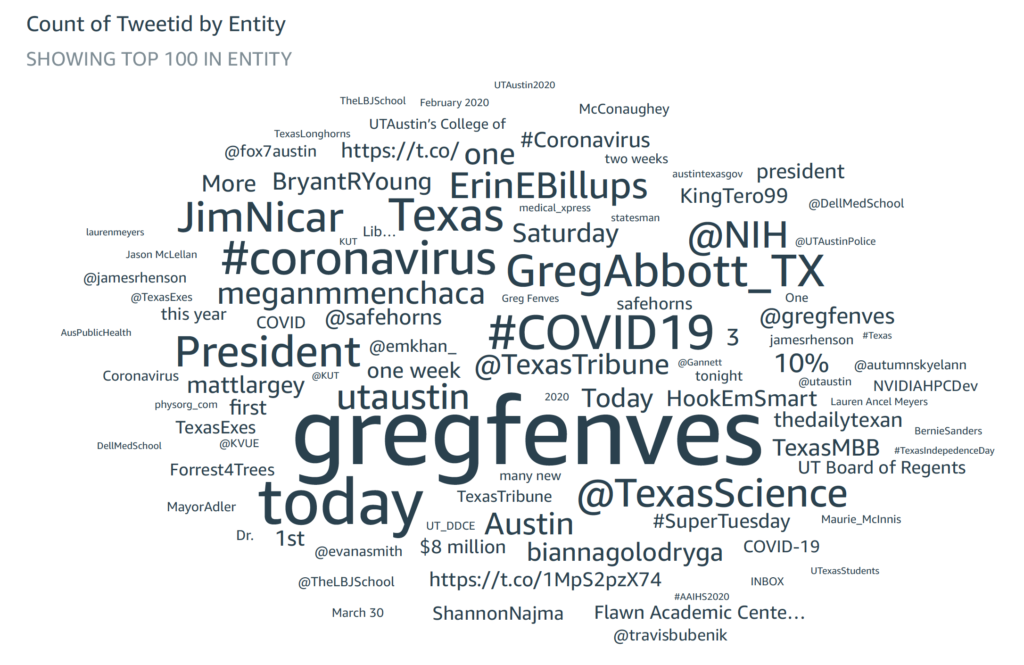
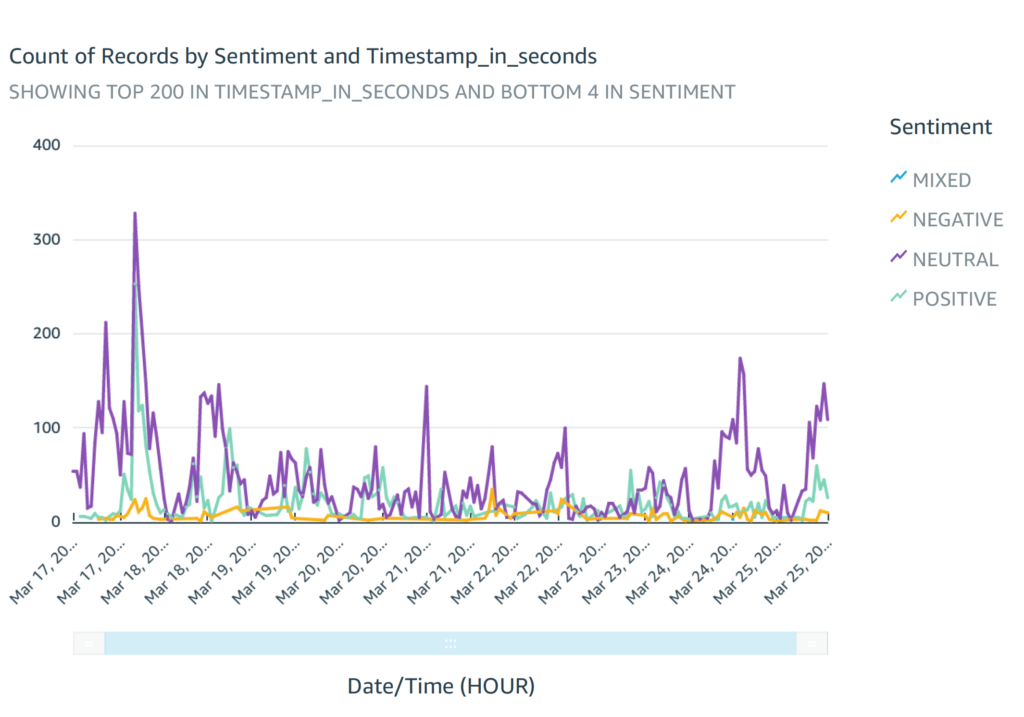
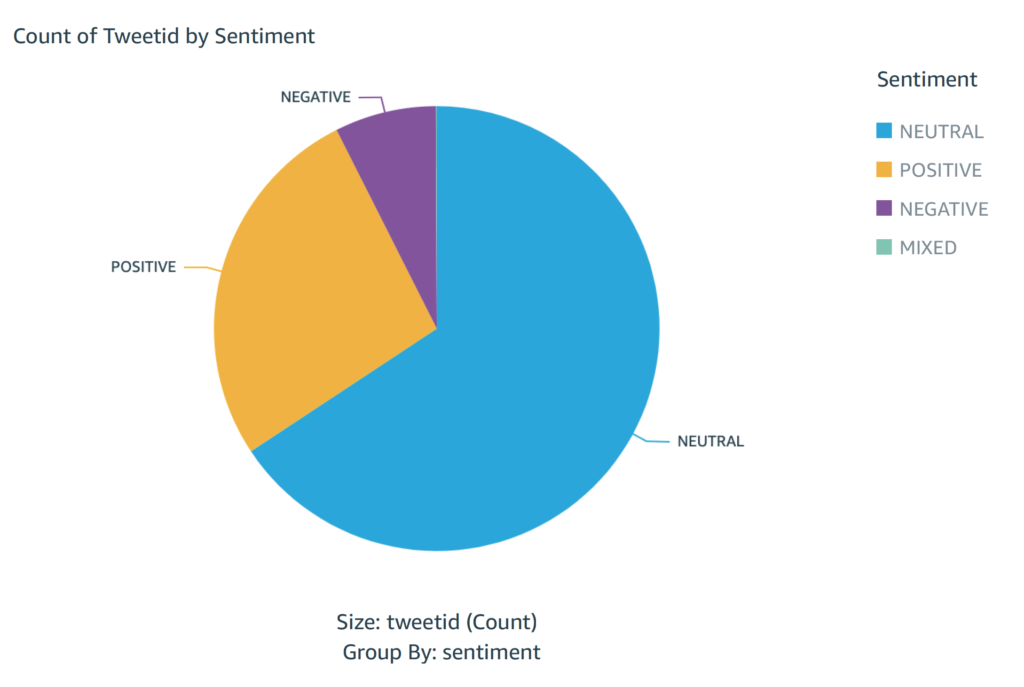
A simple dashboard offering visibility into UT’s Twitter mentions. Each mention is digitally analyzed to determine if it’s positive, neutral or negative.
Impact
Could this solution be applied to other problems? Perhaps with some modification?
Cost Analysis
| Description of cost | Used | Unit | Cost | |
| Athena | $5 per query in Terabytes | 0.011 | TB | $0.06 |
| Comprehend | >50k, <1M units of text: $.0001 per unit | 33540 | units of text | $3.35 |
| ECR | $.1 per GB-month | 64 | MB | $0.10 |
| EC2 Container Service (Fargate) | Memory: $0.004445 per GB per hour | 880 | hours | $3.91 |
| EC2 Container Service (Fargate) | vCPU: $0.04048 per vCPU per hour | 440 | hours | $17.81 |
| Kinesis | Tier 1 $.029 per GB of data ingested | 0.354 | GB | $0.01 |
| Lambda | Compute: $0.0000166667 for every GB-second | 1699.413 | GB-seconds | $0.03 |
| Lambda | Requests: $0.20 per 1M requests | 5,628 | requests | $0.20 |
| Total | $25.47 |